

SMBs don’t lose money on compensation because they don’t care; they lose money because they anchor decisions to bad market data—data that is inaccurate, irrelevant, outdated, or misused.
The result is a chain reaction: mispriced roles → perceived unfairness → engagement drag → turnover → emergency corrections and brand damage.
Reliable salary benchmarks services help reduce these costly mistakes early. The fix isn’t enterprise‑grade spend, it’s enterprise‑grade discipline: better anchors, better job matching, better refresh cadence, and better manager enablement.
The Causal Chain: How Bad Data Quietly Sends You the Bill
When an SMB relies on poor salary benchmarks services or mis-fit salary benchmarks, the cost rarely appears as a single line item. It arrives as a hidden invoice spread across the year:
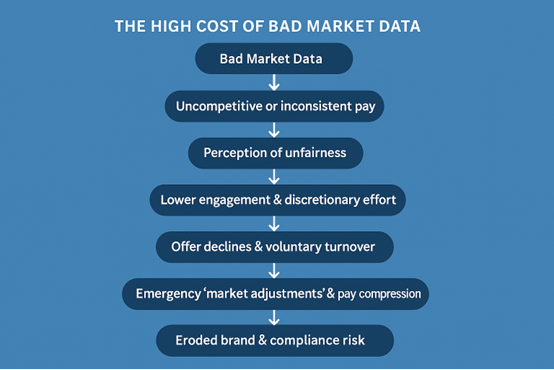
The paradox: pay is your largest expense and your most public promise. Misprice it, and you create an arbitrage opportunity for competitors to out-recruit you—often without increasing their budgets, just by aiming more accurately.
What “Bad Market Data” Really Is (and Why It’s So Common)
“Bad data” isn’t only “wrong.” In SMBs, the more dangerous failure is mis‑fit:
- Inaccurate: Crowd‑reported numbers, scraped aggregations, title inflation, unclear mix of base vs. total cash.
- Irrelevant: Wrong peer sets (all industries vs. your niche), wrong geographies, wrong company sizes, mismatched job definitions.
- Outdated: Stale benchmarks in hot markets (software, data, healthcare) where movement outpaces generic inflation.
- Misused: Good surveys applied incorrectly—poor job matching, national numbers used for high‑cost metros, ignoring range structures.
None of this is malicious. It’s a rational shortcut in resource‑constrained environments. This is why many SMBs invest in salary benchmarks services. They aid in delivering accurate and relevant market data. But shortcuts here bias your inputs and compound over time.
Why SMBs Are Especially Vulnerable
Budget constraints matter. The whole story is a lot more, though. SMBs also face structural and behavioral traps:
- Thin specialization: HR generalists wear many hats; founders/CFOs lead comp without deep market‑matching expertise.
- Anchoring & availability: Leaders anchor to last year’s pay (plus 3%), to the last tough negotiation, or to the first number from a quick search.
- Title drift: Internal titles (e.g., “Engineer II”) mask scope that actually maps to market “Senior.” Mis‑leveling is a silent underpay driver.
- Over‑generalization: One national number applied everywhere; “all‑industry” data used for niche roles; base pay blended with variable pay.
These patterns tilt your decision‑making toward convenience data (search results, candidate anecdotes, job postings) rather than curated, comparable data.
Accurate salary benchmarks services support fair pay decisions before problems grow.
The Direct Cost: Overpaying, Underpaying, and Paying Twice
If your peer set or geo cut runs “hot,” you can overshoot by 10–20%. Example: Using high‑cost city benchmarks for a mid‑cost metro or mapping inflated titles as peers.
- Simple Math: Ten roles targeted at $100k, paid 15% high = $150,000/year. That’s often more than a targeted survey program for multiple years.
Underpaying: The Expensive Invisible Leak
Underpricing critical roles by 5–10% doesn’t just save base pay; it raises quit rates and lowers engagement. People with strong outside options leave earlier; those who stay often reduce discretionary effort. You don’t see a clean invoice—you feel it in project slippage and missed targets.
- Scenario: A 50‑person product company underprices Sr. Engineers by 10%. Over 18 months:
- 3 exits occur earlier than planned.
- Recruiting & agency costs: $25–40k per hire.
- Ramp‑up productivity loss (3–6 months): $30–60k per hire.
- Delivery delays & opportunity cost: easily six figures.
By the time you tally recruiting, ramp, rework, and manager time, the “savings” on base salary are swamped—$250–400k gone before you update a single range. This is where salary benchmarks services deliver long-term value. They help organizations make correct pay decisions from the start.
Paying Twice: Emergency Adjustments & Compression
Underpaying triggers mid‑year market adjustments, counteroffers, and sign‑on bandaids. New hires come in at corrected market while incumbents remain lower—classic pay compression—forcing second‑order adjustments and further volatility. Reliable salary benchmarks services help reduce these costly adjustments. It supports more accurate pay decisions from the start. You don’t just pay; you re‑pay.
Indirect Cost: Engagement, Brand, & Compliance
- Engagement & fairness: Employees triangulate pay via job ads. While also considering salary sites and internal comparisons. Visible misalignment erodes trust. Manager credibility feels the impact too. Perceived fairness often predicts engagement and intent to stay as strongly as absolute pay.
- Employer brand: In pay‑transparent markets, your posted ranges are marketing. If they lag, candidates opt out earlier or demand late‑stage uplifts. Offer declines and time‑to‑fill climb, particularly in competitive roles.
- Equity & legal exposure: Noisy or mismatched benchmarks can obscure systematic underpayment for certain groups. As transparency and equity rules expand, the cost of retrospective fixes grows—financially and reputationally.
The Data Debate, Settled Practically: Free vs. Paid vs. “Good‑Enough”
Free crowd‑sites feel hyper‑current but are noisy (self‑selection, unclear leveling). Scraped job ads reflect offered ranges, not accepted pay, and titles vary wildly. Curated surveys update slower but deliver data hygiene—audited submissions, clear job codes, and cuts by industry, size, and metro.
What Actually Wins:
- One reliable anchor per critical job family/geo, plus
- Disciplined application (job matching, leveling, refresh cadence, manager education).
Early stage? Free/official data may be a starting point—directional, not destiny. As soon as you’re making multiple hires in a job family or competing in hot markets, free data becomes a liability.
This is where market pricing & salary benchmarking provide a stronger foundation for consistent compensation decisions.
Strong salary benchmarks services make every compensation structure more reliable.
Three Practical Frameworks You Can Use Tomorrow
1) Market Data Reliability Hierarchy (from strongest to weakest anchor)
- Curated, audited surveys (with industry/size/geo cuts)
- Government labor data (useful cross‑check; coarser for tech/pro roles)
- Accepted offer data (rare, but gold when available)
- Job posting ranges (current but wide; negotiation‑biased)
- Crowd‑reported sites (directional only; check for scope and mix)
- Anecdotes (recruiters and candidates: use to probe, not to price)
Rule: Anchor to the highest reliability you can afford. Use others as triangulation or trend indicators.
2) Role Sensitivity Matrix (prioritize where precision pays)
Plot roles on two axes: Market Volatility (how fast pay moves) × Business Impact (revenue/client/mission criticality). Reliable salary benchmarks services help organizations. They make it easy to prioritize these roles with greater confidence and accuracy.
- Top‑right (High/High): Sales, Sr. Engineering, Data, Clinical specialists → Invest in premium data and semi‑annual refresh.
- High Impact/Low Volatility: Finance leads, key operations → Good surveys + annual review.
- Low Impact/High Volatility: Junior tech roles → tighter ranges, watch movement.
- Low/Low: Admin/support → official data cross‑check may suffice.
3) Comp Data Governance Loop (make good data actually work)
Job Matching → Calibration → Cadence → Communication → Feedback → (repeat)
- Job Matching: Map on content and scope, not titles. Document rationale and survey codes.
- Calibration: Cross-check with government data and reliable salary benchmarks services. Selectively compare postings and sanity-check with recent hires.
- Cadence: Annual full review; interim checks for hot roles.
- Communication: Manager toolkits on market median, compa‑ratio, and range use.
- Feedback: Use offer acceptance and time‑to‑fill. Also, consider internal equity audits to tune.
Emerging Trends to Anticipate: Where Bad Data Hurts Faster
- Pay Transparency Expansion: Your ranges are now public signals. Mis‑fit data is instantly visible and invites challenges from candidates and employees.
- AI & “live” Pay Data: New tools scrape and model from postings and self‑reports—useful to detect directional movement, but validate with curated anchors before changing structures.
- Skills‑based Pay: Hybrid roles (e.g., product‑data‑engineering) strain traditional job codes. Prioritize content‑based matching over title matching.
- Remote Differentials: HQ rates vs. local cost‑of‑labor vs. hybrid models—small mis‑assumptions at scale = big compounding errors across distributed teams.
A 30‑60‑90 Day Plan to Stop the Bleed (Right‑Sized for SMBs)
Next 30 Days — Diagnose & Anchor
- Audit Current Sources: What’s accurate, relevant, current? Where are we misusing good data?
- Identify impact roles using the Role Sensitivity Matrix.
- Select one curated survey or trusted salary benchmarks services. Do this for your most critical family/geo, then add a government data cross-check.
- Stand up a job‑matching worksheet: internal summary, external code, leveling, rationale.
Days 31–60 — Calibrate & Communicate
- Rebuild ranges for top roles using your anchor survey, plus metro/industry/size cuts.
- Calibrate with offer acceptance, time‑to‑fill, and recent hire pay. Adjust for market movement.
- Create a one‑page manager guide: market median vs. midpoint, compa‑ratio, range use, promotion vs. market moves.
- Pilot with one department; collect feedback.
Days 61–90 — Govern & Refresh
- Roll out updated ranges to all high‑impact roles; schedule semi‑annual check‑ins for hot markets.
- Implement an equity pulse (lightweight analysis for compression and gaps).
- Close the loop: track offer declines, hiring speed, and internal mobility. Use the data to tune.
Mini‑Cases: Composite Patterns
- Tech SMB, Under‑market by 15%: Relying on crowd data + national medians in a hot metro, the firm lost four senior ICs, slipped two releases, and spent six figures on backfills. The company then adopts salary benchmarks services and metro-specific survey data. Offer declines drop sharply, and time-to-fill improves by three weeks. Survey costs were recouped with one avoided agency fee.
- Professional Services, Geo Mismatch: Using “all‑industry” national data for client roles in a high‑cost city drove chronic late‑stage uplifts. Switching to city‑specific benchmarks and clarifying levels reduced mid‑year adjustments by half and stabilized margins.
The Mindset Shift: Treat Comp Like Product Pricing
Most SMBs obsess over product pricing with rigorous market research—and then set pay (their largest expense and a core brand signal) on looser standards. The shift is not “spend like an enterprise.” It’s think like one:
- Use the best anchor you can afford for roles that matter.
- Apply discipline in matching, leveling, and cadence.
- Educate leaders so good data doesn’t die in a bad process.
- Measure outcomes (acceptance rates, time‑to‑fill, equity pulses) and tune.
Bottom Line: Consistent salary benchmarks services help SMBs build smarter long-term compensation strategies. The most expensive compensation strategy is often the one built on “cheap” data. You don’t need perfect data—you need good‑enough data, applied with great discipline.
Want a Safe, Fast Start?
I offer concise compensation data diagnostics and practical salary benchmarks services for SMBs. A pro bono version for nonprofits—to pinpoint where your benchmarks are solid, where they’re fragile, and what one or two right‑sized upgrades would deliver the highest ROI. One disciplined move (a targeted survey for a critical family, for example) can pay for itself in a single avoided backfill.
If you wouldn’t price your product on guesswork, don’t price your people that way either.